Your story leads. The data has its back.
You built something real. People, a place, a reason to exist. We don't flatten that into a spreadsheet, and we don't let it float on adjectives.
The story leads. Scan data guides it from the background, then steps forward when a decision needs backing.
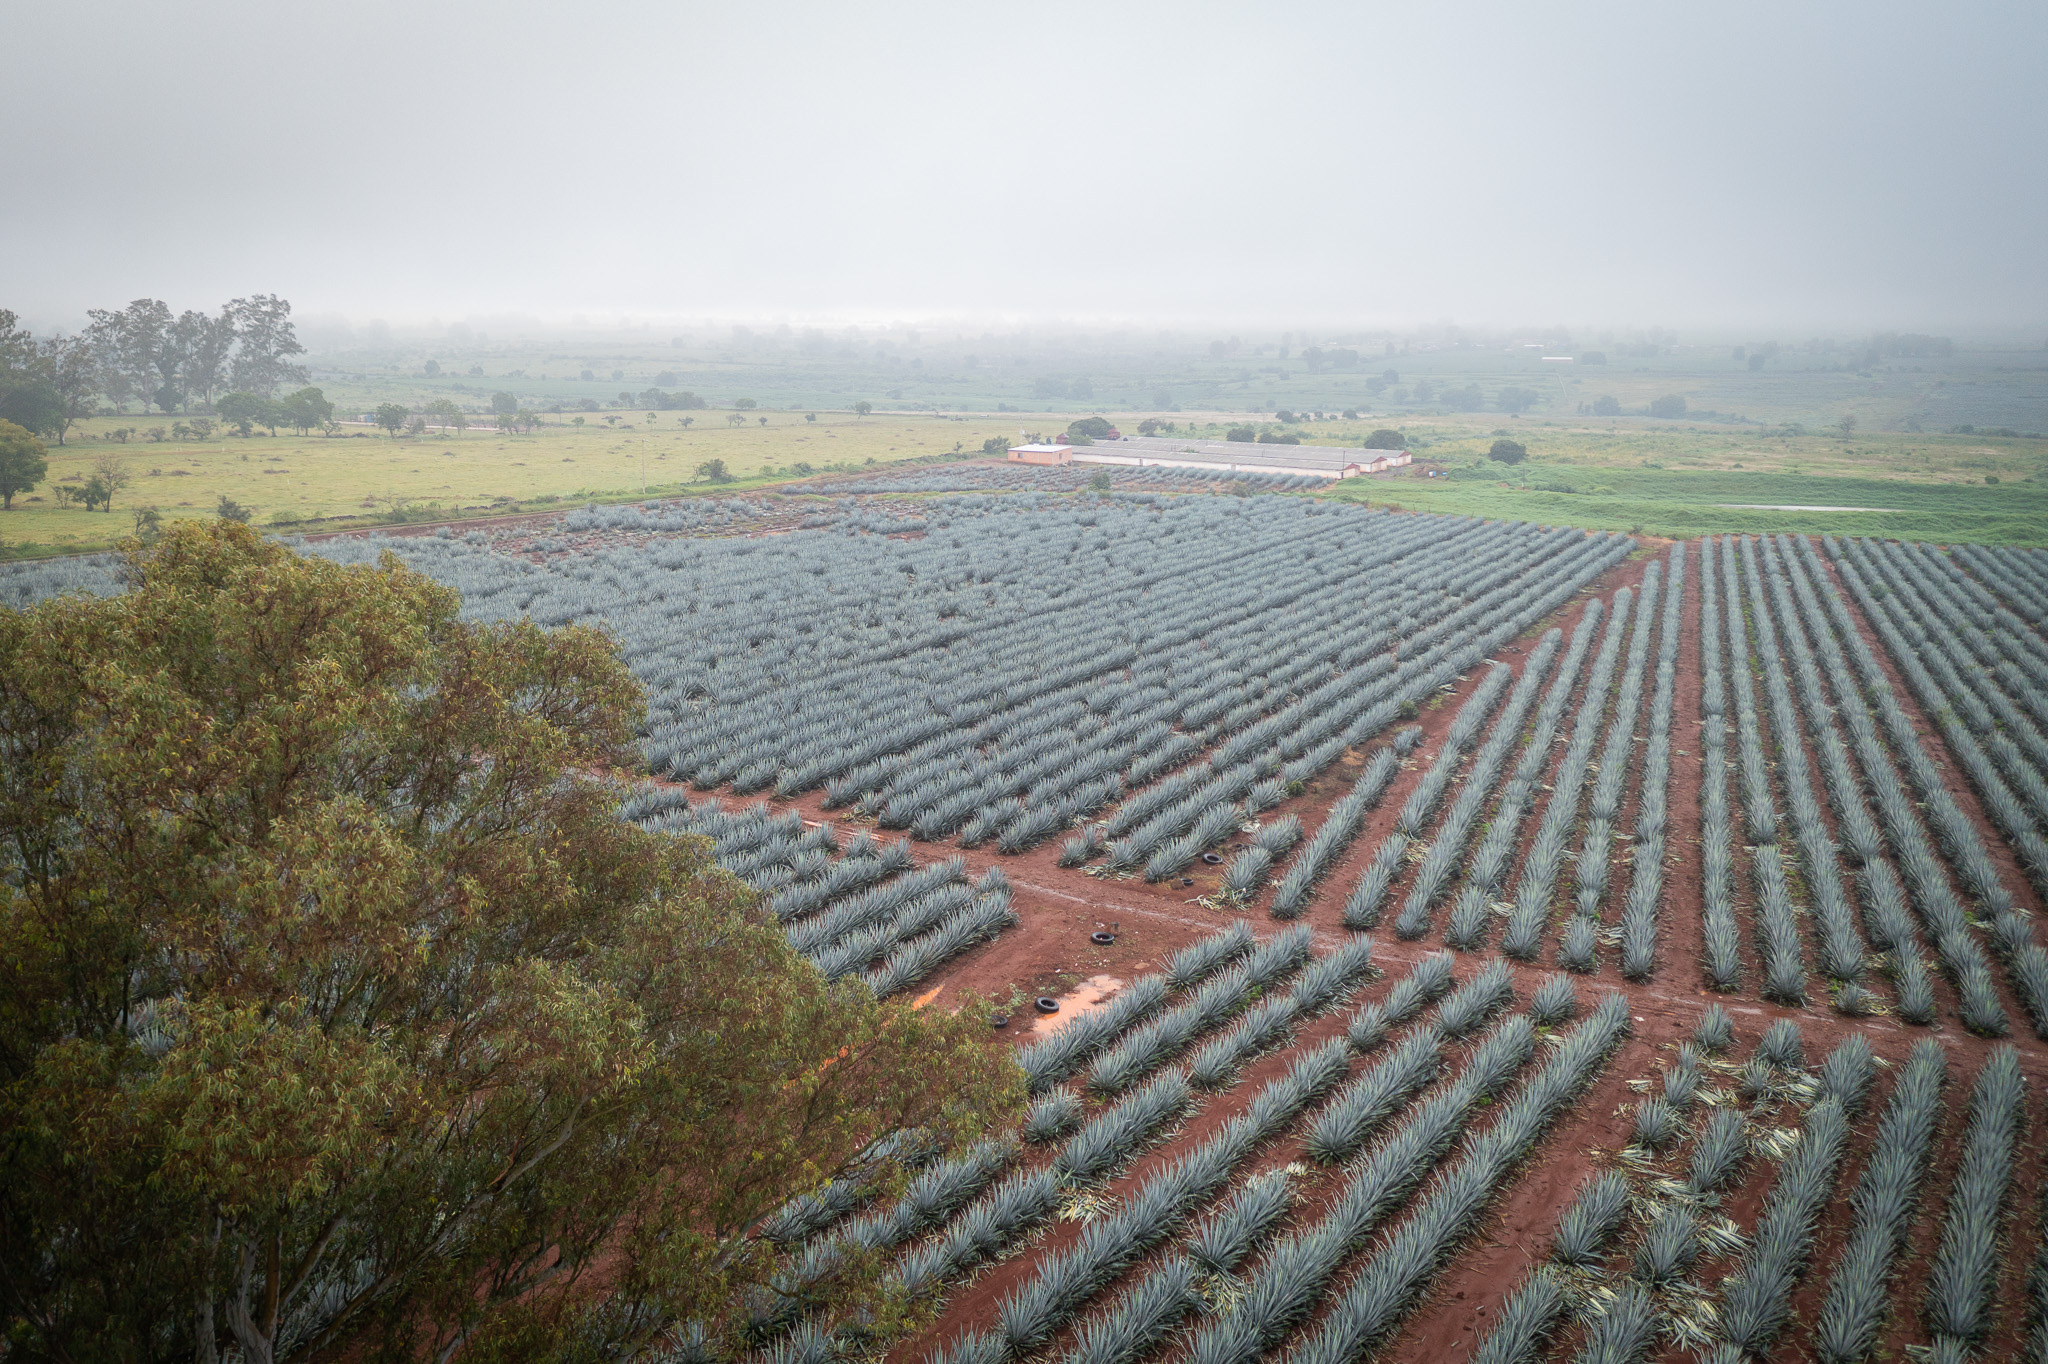
The work, and what it moved.

Story and shelf, moving together.
The story went out through earned channels first. Then a 25-page review on three years of scan data went to the buyers, and the velocity diagnostics became the sales story.
One distributor in one state became 22 across ten. Velocity held the whole way, on under 4% distribution.
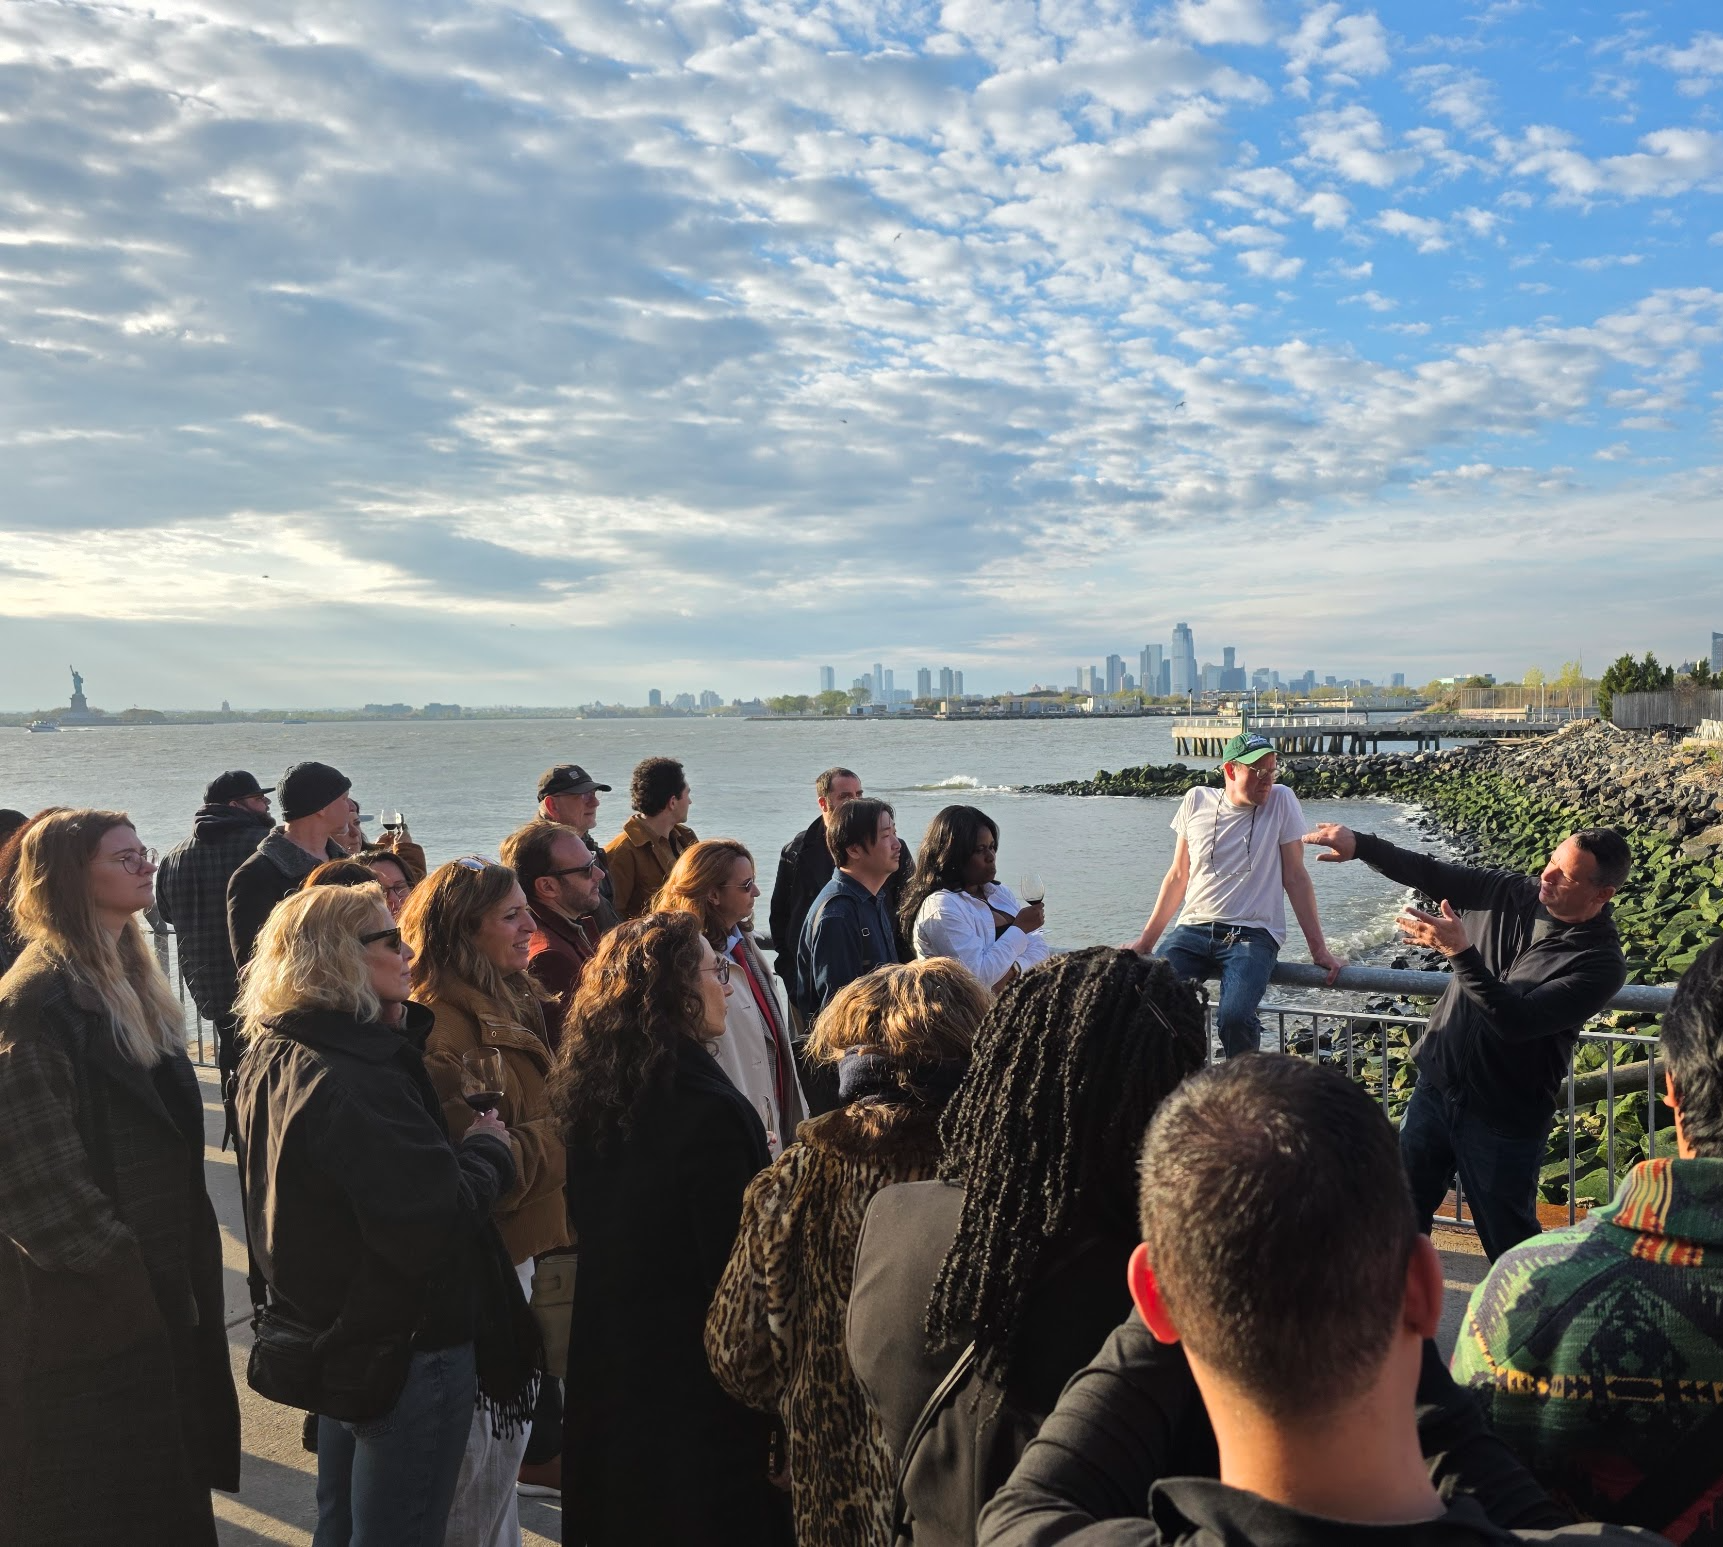
A launch the press showed up for.
A distillery and waterfront hospitality startup, taken to market on earned media instead of paid. PR, organic social and live activation run as one engine.
72% of the reach came from audiences the brand had never touched, which compounds instead of resetting when the spend stops.
Monday morning, the reading is already done.
A standing weekly reading: executive summary, key markets, retailer scorecards, and an at-risk report ranked by cases at stake.
The time comes back as store visits, distributor rides and tastings.
Forecasts, scored in public.
Seventeen papers across tequila and American whisky this year, each built on weekly scan data with the methodology in the back.
When a paper puts a number on the future, the next one grades it. The July scorecard graded a March forecast line by line, correction included.
What we build
Brand story & earned media
Your story, in your voice, told across the channels it earns.
Category reviews
Multi-year scan reads: velocity by tier, price and pack, door economics, channel calls.
Scenario models
Bear, base and bull paths, each with the trigger metrics that tell you which one you're on.
Retail sales stories
Buyer decks built from the current reading. The pitch, the planogram argument, the velocity receipts.
Dashboards & reporting
Readings that arrive on schedule, and reports your team can actually use.
Trade programs & playbooks
Commercialization plans, displays and merch, playbooks timed to monthly retailer priorities.
A model earns its keep when you score it.
In March we put three paths on high-proof tequila for the full year. In July we published the checkpoint.
Five months in, the segment was tracking within a point of the base case and the bull window had closed. We held the base and narrowed the range to $25.5M–$27.5M.
The report nobody has to build.
Two live examples. The at-risk report is the one that changes behavior, because it ranks lapsed accounts by the cases they were carrying before they stopped ordering.
Senior operators, not a bench.
Strategy, execution and measurement stay with the same people, so the story on the shelf, in the deck and in the data never drift apart.
We read the category before we touch the data. The narrative comes first, then the numbers that hold it up.
Two rules we don't bend. Every figure traces to a named source with a geography and a date range. And if the number doesn't support the claim, the claim doesn't go in.
One number for strategy, management and intelligence.
Subcontractors billed at what they bill us.
The crunching runs itself, so budget faces the market.
The Bench: cocktail math, worked out.
Dilution, final ABV, batch scaling, cost per pour. We built it for our own bar work and left it open.
No signup. No email.
OPEN THE BENCH →
Your category has a story like this. Let's take the reading.
The first conversation is free, and you don't need to bring numbers.
START A CONVERSATION